EconomyRanked: Productivity of the World’s Largest 30 Economies (2005-2025)Published 2 days ago on November 20, 2025
By Bruno Venditti
Published in Visual Capitalist https://www.visualcapitalist.com/ranked-productivity-of-the-worlds-largest-30-economies-2005-2025/?fbclid=IwY2xjawOOG2JleHRuA2FlbQIxMQBzcnRjBmFwcF9pZBAyMjIwMzkxNzg4MjAwODkyAAEe0CXMqPBGEeO79qgriFlpnCiy3oNLGd9UcAjVHUEK448L_F-El9qLsI1CacY_aem_0GeLJr7wtunke4x5eMnWjQ
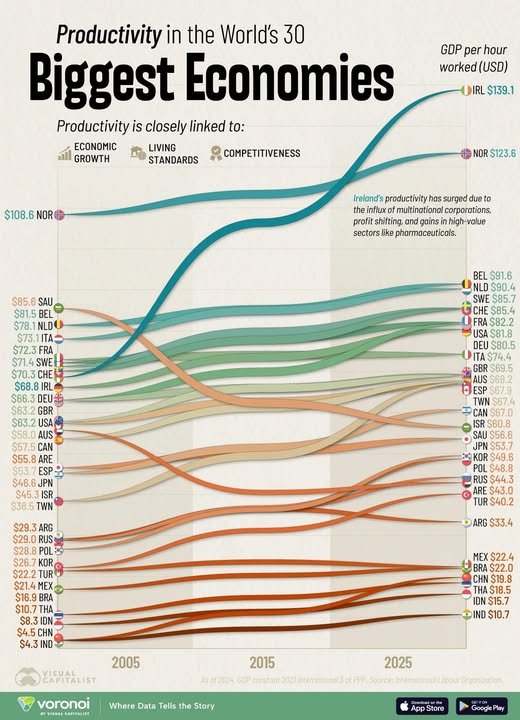
Productivity of the World’s Largest 30 Economies (2005-2025)
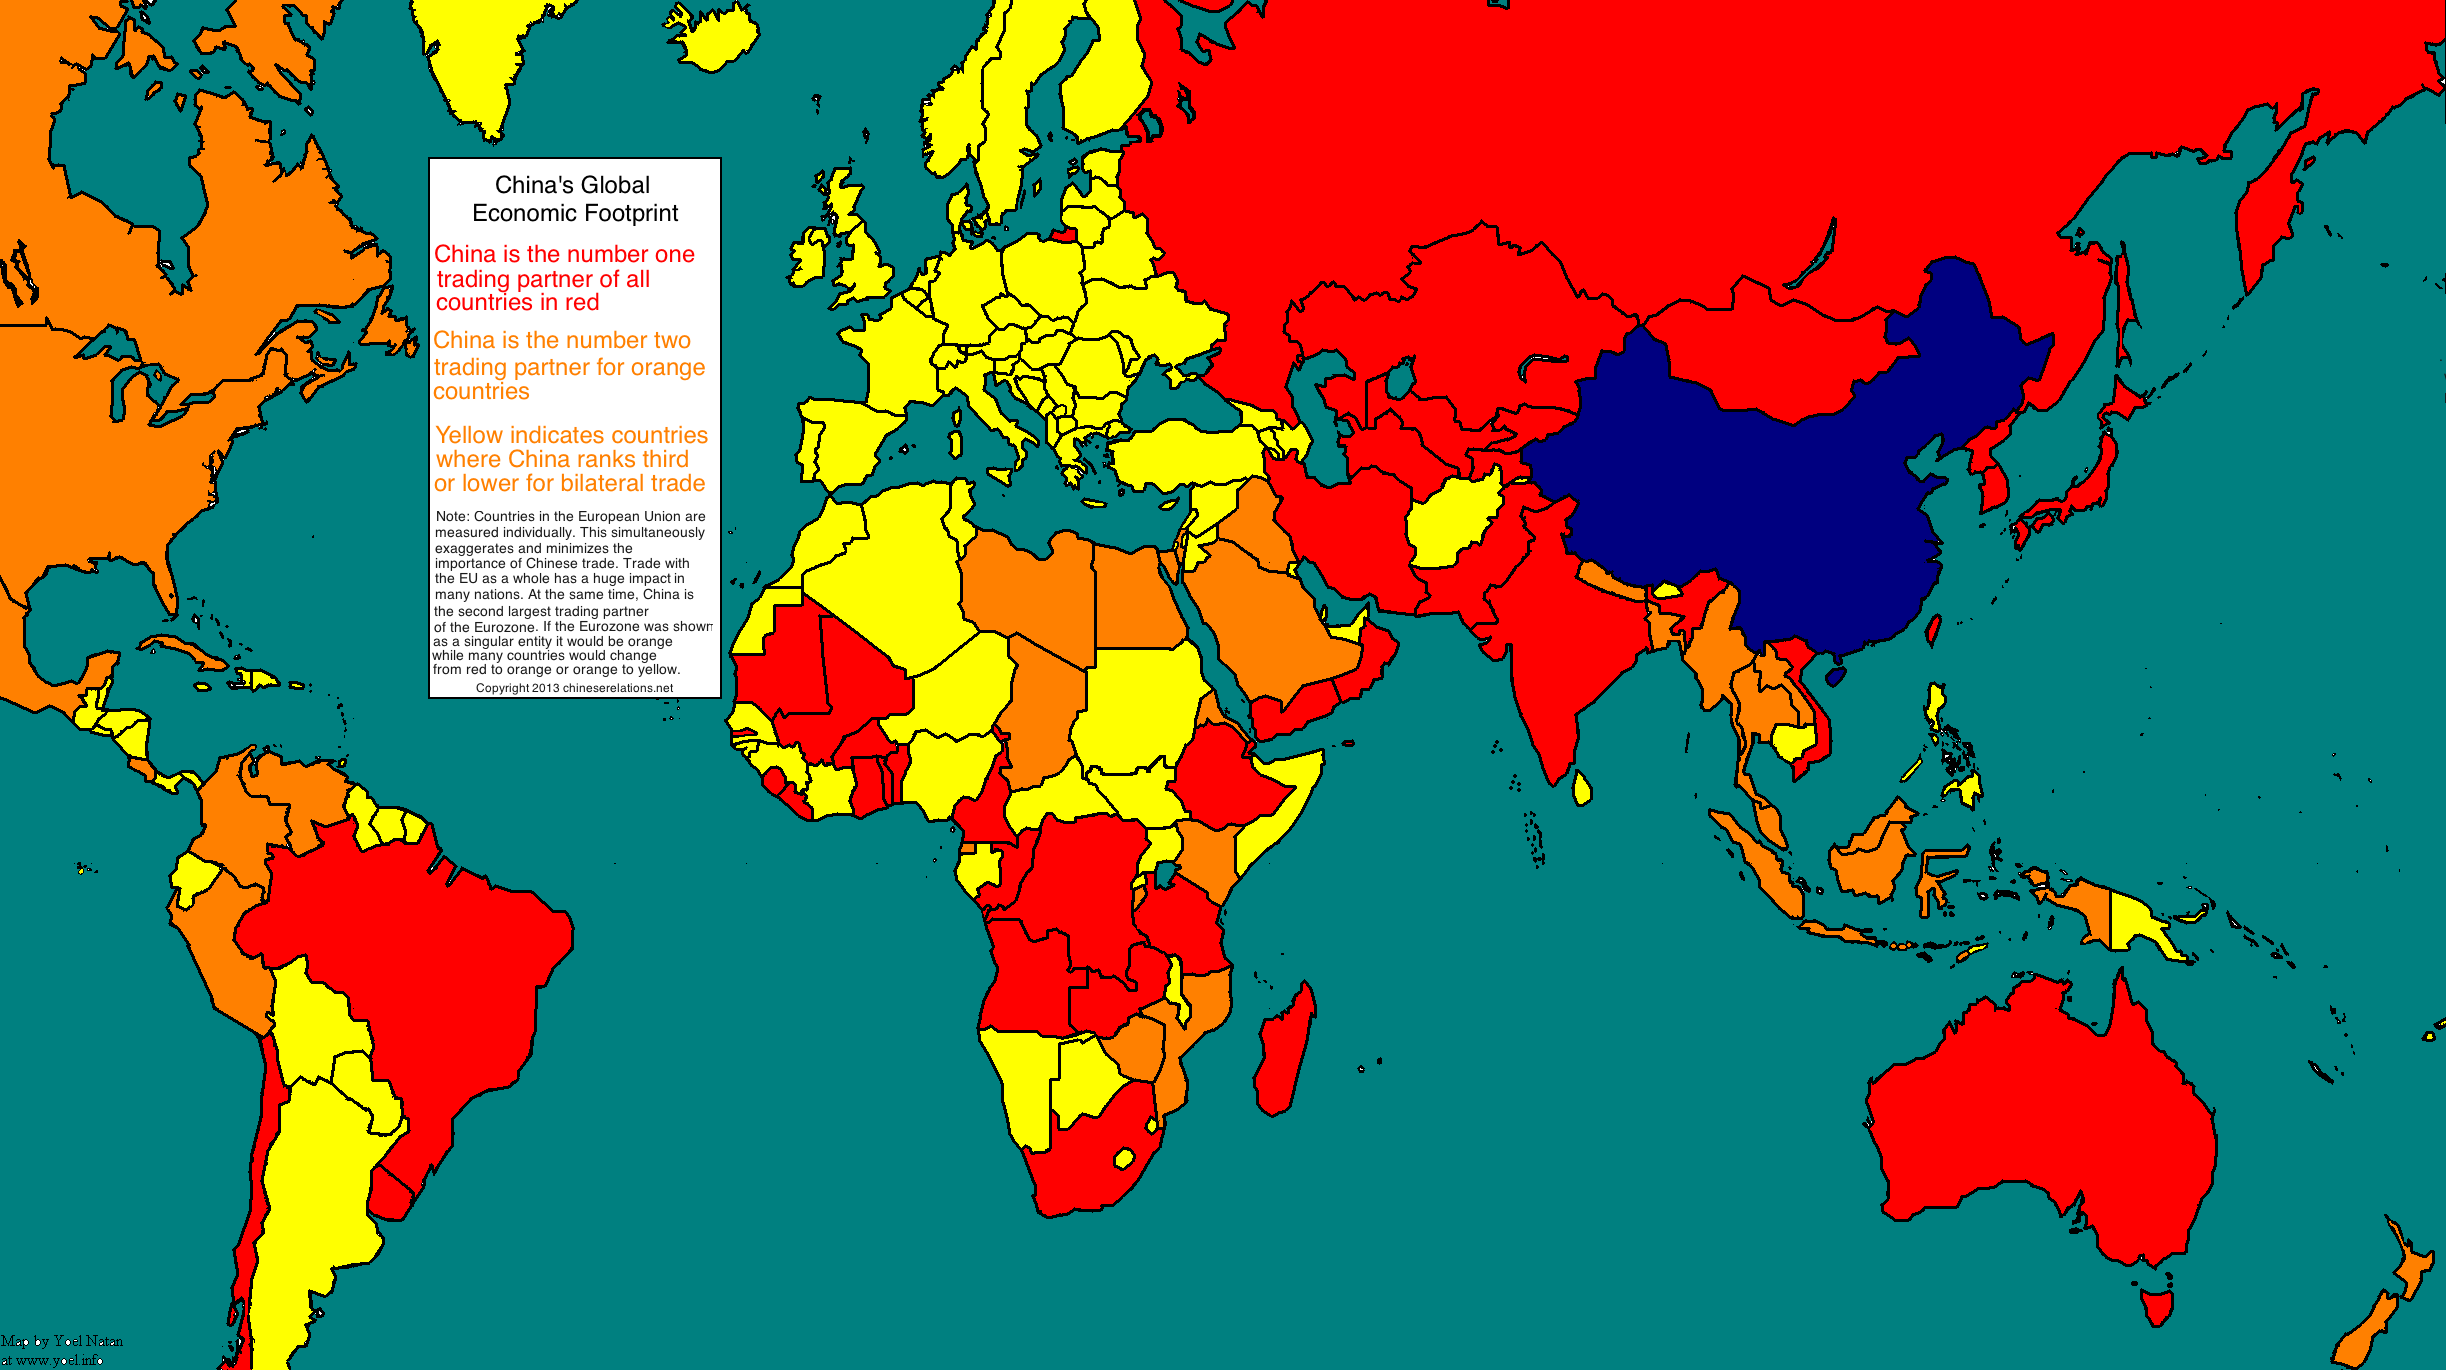
China’s productivity has surged by about 340% since 2005, driven by rapid industrial upgrades and investment in technology. However, growth has slowed in recent years.
Ireland’s productivity appears high due to a tax system that lets global tech and pharma firms book profits and intellectual property earnings in the country, even though most of the money goes back to their parent companies.
Saudi Arabia’s productivity has declined over the past two decades, mainly due to lower oil prices in the mid-2010s and OPEC+ production cuts that limited output. Non-oil sectors are growing, but the economy still depends heavily on hydrocarbons.
The U.S., Germany, and France have all seen consistent gains. The U.S. rose from $63.2 to $81.8, Germany from $66.3 to $80.5, and France from $72.3 to $82.2 over the 20-year span.
By contrast, Norway, another resource-rich economy, maintains one of the world’s highest productivity levels at $123.6 per hour, thanks to strong governance, sovereign wealth reinvestment, and a highly skilled workforce.
Western Europe continues to outperform on efficiency thanks to automation and worker training, while Japan and the UK have grown more slowly due to aging populations and stagnant investment.
Economic productivity, measured by the value of goods and services produced per hour worked, is a key indicator of efficiency and overall prosperity.
This chart ranks the world’s 30 largest economies by GDP per hour worked (in U.S. dollars), revealing where output has grown or stagnated over the past two decades.
While advanced economies tend to dominate the top of the list, some emerging markets have seen extraordinary gains as they industrialize and integrate into global supply chains. The data for this visualization comes from the International Labour Organization (ILO).
Author: Saikat Bhattacharya